> > India >> States >> Districts in India
do you want to know How many districts in Chhattisgarh / Total district in Chhattisgarh ?
Nestled in the heart of central India, Chhattisgarh stands as a state characterized by its rich natural beauty, tribal heritage, and burgeoning industrial landscape. As of the latest available information in 2023, Chhattisgarh is administratively organized into 33 districts, each contributing to the state’s socio-economic fabric, cultural diversity, and developmental aspirations.
Rajnandgaon district covering an area of 8062 km² is the largest district and Dhamtari District is the smallest district of Chhattisgarh. Raipur District is the most populated district and Narayanpur District is the least populated district in Chhattisgarh
New Districts
In September 2022, five new districts were inaugurated: Manpur-Mohla on the 2nd of September, Sarangarh-Bilaigarh on the 3rd of September, and Manendragarh and Sakti districts on the 9th of September. Newly district Khairagarh-Chhuikhadan-Gandai was announced on 17 April 2022 and Inaugurated on 3rd September 2022.
read about the population of Chhattisgarh
Chhattisgarh District List
| # | District | Population (2011) | Area (km2) | Density (/km2) |
| 1 | Raipur | 2,160,876 | 2,914.37 | 742 |
| 2 | Durg | 1,721,948 | 2,319.99 | 742 |
| 3 | Bilaspur | 1,625,502 | 3,511.10 | 463 |
| 4 | Korba | 1,206,640 | 7,145.44 | 169 |
| 5 | Raigarh | 1,112,982 | – | – |
| 6 | Baloda Bazar | 1,078,911 | 3,733.87 | 290 |
| 7 | Mahasamund | 1,032,754 | 4,963.01 | 208 |
| 8 | Janjgir-Champa | 966,671 | 4,466.74 | 360 |
| 9 | Rajnandgaon | 884,742 | 8,070 | 110 |
| 10 | Jashpur | 851,669 | 6,457.41 | 132 |
| 11 | Surguja | 840,352 | 5,019.80 | 167 |
| 12 | Bastar | 834,873 | 6,596.90 | 213 |
| 13 | Balod | 826,165 | 3,527.00 | 234 |
| 14 | Kabirdham | 822,526 | 4,447.05 | 185 |
| 15 | Dhamtari | 799,781 | 4,081.93 | 196 |
| 16 | Bemetara | 795,759 | 2,854.81 | 279 |
| 17 | Surajpur | 789,043 | 4,998.26 | 158 |
| 18 | Kanker | 748,941 | 6,432.68 | 117 |
| 19 | Balrampur | 730,491 | 6,016.34 | 100 |
| 20 | Mungeli | 701,707 | 2,750.36 | 255 |
| 21 | Sakti | 653,036 | – | – |
| 22 | Sarangarh-Bilaigarh | 607,434 | – | – |
| 23 | Gariaband | 597,653 | 5,854.94 | 103 |
| 24 | Kondagaon | 578,326 | 6,050.73 | 96 |
| 25 | Manendragarh-Chirmiri-Bharatpur | 376000 | 4226 | – |
| 26 | Khairagarh-Chhuikhadan-Gandai | 368,444 | – | – |
| 27 | Gaurella-Pendra-Marwahi | 336,420 | 2,307.39 | 166 |
| 28 | Mohla-Manpur-Chowki | 283,947 | – | – |
| 29 | Dantewada | 283,479 | 3,410.50 | 83 |
| 30 | Bijapur | 255,230 | 6,552.96 | 39 |
| 31 | Sukma | 250,159 | 5,767.02 | 43 |
| 32 | Koriya | 247,427 | 2378 | 37 |
| 33 | Narayanpur | 139,820 | 6,922.68 | 20 |
read about religion of Chhattisgarh
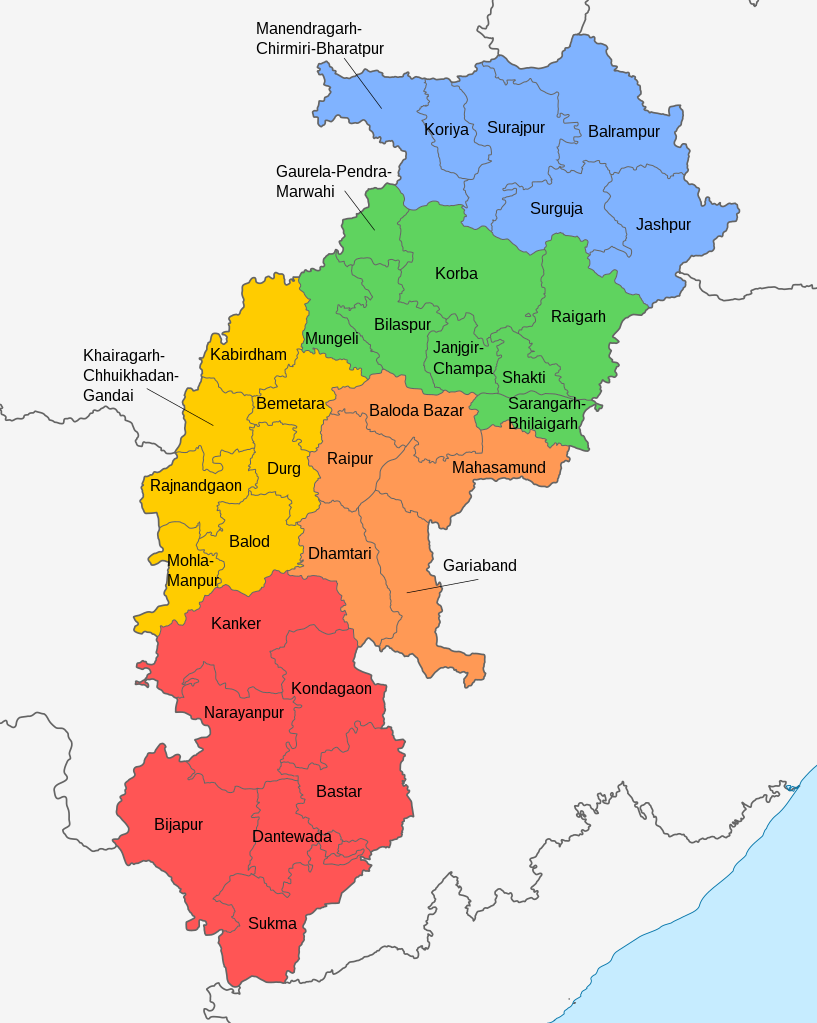
Chhattisgarh District Map
Largest and Smallest District in Chhattisgarh by Area
Rajnandgaon district covering an area of 8062 km² is the largest district in Chhattisgarh. Dhamtari District is the smallest district of Chhattisgarh with a total area is 2029 km²
| # By Area | District | Area |
| Largest | Rajnandgaon | 8062 km² |
| Smallest | Dhamtari | 2029 km2 |
Source: Census 2011
Largest and Smallest District in Chhattisgarh by Population
Raipur District is the most populated district in Chhattisgarh. Its Population as per the census 2011 is 21.60 Lakhs. Narayanpur District with a population of 140206 is the least populated district in Chhattisgarh
| # by Population | District | Population (Census 2011) |
| Most Populated | Raipur | 2,160,876 |
| Least | Narayanpur | 140,206 |
Highest and Lowest Population Density
Raipur District ( 747 people per km) has the highest Population density in Chhattisgarh. Narayanpur District with a population density of 20 people per km is the lowest-density district in Chhattisgarh.
| # by Density | District | Density (person/km) |
| Highest | Raipur | 747 |
| Least | Narayanpur | 20 |
Source: Census 2011
Chhattisgarh District by Literacy | Sex ratio
| # | District | Sex Ratio | Literacy rate |
| 1 | Balod | 1022 | 80.4 |
| 2 | Baloda Bazar | 1010 | 70.26 |
| 3 | Balrampur | 976 | 57.64 |
| 4 | Bastar | 1016 | 52.10% |
| 5 | Bemetara | 1003 | 70.58% |
| 6 | Bijapur | 984 | 40.86% |
| 7 | Bilaspur | 964 | 74.46% |
| 8 | Dantewada | 1023 | 42.12% |
| 9 | Dhamtari | 1010 | 78.36% |
| 10 | Durg | 977 | 72.40% |
| 11 | Gariaband | 1020 | 68.26 |
| 12 | Gaurella-Pendra-Marwahi | 997 | 55.92 |
| 13 | Janjgir-Champa | 986 | 73.07% |
| 14 | Jashpur | 1005 | 67.92% |
| 15 | Kabirdham | 996 | 60.85% |
| 16 | Kanker | 1006 | 70.29% |
| 17 | Kondagaon | 1016 | 57.31% |
| 18 | Korba | 969 | 72.37% |
| 19 | Koriya | 968 | 70.64% |
| 20 | Mahasamund | 1017 | 71.02% |
| 21 | Mungeli | 974 | 64.70% |
| 22 | Narayanpur | 994 | 48.62% |
| 23 | Raigarh | 991 | 73.26% |
| 24 | Raipur | 981 | 80.52 |
| 25 | Rajnandgaon | 1015 | 75.96% |
| 26 | Sukma | 1017 | 29 |
| 27 | Surajpur | 980 | 60.95% |
| 28 | Surguja | 978 | 60.01% |
Source: Census 2011
Chhattisgarh District with Highest and Lowest Literacy rate
| # by Literacy Rate | District | Literacy Rate |
| Most Literate | Raipur | 80.52% |
| Least | Bijapur | 40.86% |
Source: Census 2011
Chhattisgarh District with Highest and Lowest Sex Ratio
Dantewada district (1023) has the highest Male-Female Sex ratio in Chhattisgarh. Bilaspur District (964) has the lowest male-female sex ratio in Chhattisgarh
| # by Sex Ratio | District | Sex ratio |
| Highest | Dantewada | 1023 females to 1000 males |
| Lowest | Bilaspur | 964 females to 1000 males |
Source: Census 2011
Know more about Chhattisgarh
